NCAA Tournament – Quantitative Reference Thread
With respect to the HLOH Bracketology thread, the following is provided as supplementary reference information.
Note that this is not intended to be a discussion thread for the 2020 NCAA Tournament - just a 'numbers' thread.
NCAA Tournament Odds by Seed - BetFirm.com - March 12, 2019
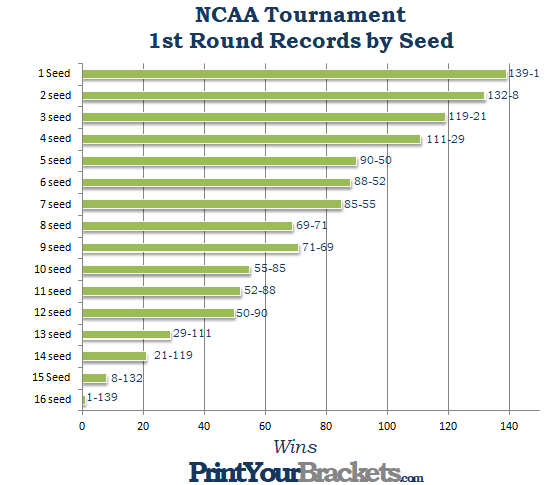
NCAA Tournament First Round Record by Seed - PrintYourBrackets.com – April 10, 2019
Those of you with a decent knowledge of Probability & Statistics might be interested in the following scholarly 32-page .pdf slide show:
Seed Distributions for the NCAA Men’s Basketball Tournament: Why it May Not Matter Who Plays Whom – Sheldon H. Jacobson, Department of Computer Science, University of Illinois – 2011
Note that this is not intended to be a discussion thread for the 2020 NCAA Tournament - just a 'numbers' thread.
NCAA Tournament Odds by Seed - BetFirm.com - March 12, 2019
-----------------------------------------------------------------------------------------------------------------------------------------------------------------------------------------------TABLE: Odds to Advance to Each Round of the Tourney by Bracket Seed
Tournament Win/Loss Statistics by Seeding:
TABLE: First Round
TABLE: Second Round
TABLE: Sweet 16
TABLE: Elite 8
TABLE: Final Four
TABLE: Championship Game
NCAA Tournament First Round Record by Seed - PrintYourBrackets.com – April 10, 2019
-----------------------------------------------------------------------------------------------------------------------------------------------------------------------------------------------We have collected data from the past 35 NCAA Tournaments. The information below is from 1985 through 2019. The first year there were 64 teams in the tournament was 1985. The data shows the record of each seed in the first round of every tournament.
Records by Seed Matchup
The table below shows the records for each pairing in the first round of the NCAA Tournament. We analyzed data from 35 tournaments, and there are 4 matchups per tournament, per seeded pair(1 for each region), for a total of 140 games for each seed.
#1 Seed vs #16 Seed - 139-1 - 99.29% Winning Percentage #1 Seed
#2 Seed vs #15 Seed - 132-8 - 94.29% Winning Percentage #2 Seed
#3 Seed vs #14 Seed - 119-21 - 85.00% Winning Percentage #3 Seed
#4 Seed vs #13 Seed - 111-28 - 79.29% Winning Percentage #4 Seed
#5 Seed vs #12 Seed - 90-47 - 64.29% Winning Percentage #5 Seed
#6 Seed vs #11 Seed - 88-51 - 62.86% Winning Percentage #6 Seed
#7 Seed vs #10 Seed - 85-52 - 60.71% Winning Percentage #7 Seed
#8 Seed vs #9 Seed - 69-71 - 49.28% Winning Percentage #8 Seed
Here is the data made into a graph:
Those of you with a decent knowledge of Probability & Statistics might be interested in the following scholarly 32-page .pdf slide show:
Seed Distributions for the NCAA Men’s Basketball Tournament: Why it May Not Matter Who Plays Whom – Sheldon H. Jacobson, Department of Computer Science, University of Illinois – 2011
